Affordable Housing Insights Vision Report 2026
A clearer picture of why communities lose housing
This report lays out what the Affordable Housing Insights Hub is built to do: bring population, housing, and homelessness data into a single view — so communities can see where the gap is, what it would take to close it, and whether their efforts are working.
"You can't treat your way out of a supply problem. You can't supply your way out of a treatment gap. Both matter — and measurement is what tells you which constraint is binding where."
What the gap looks like
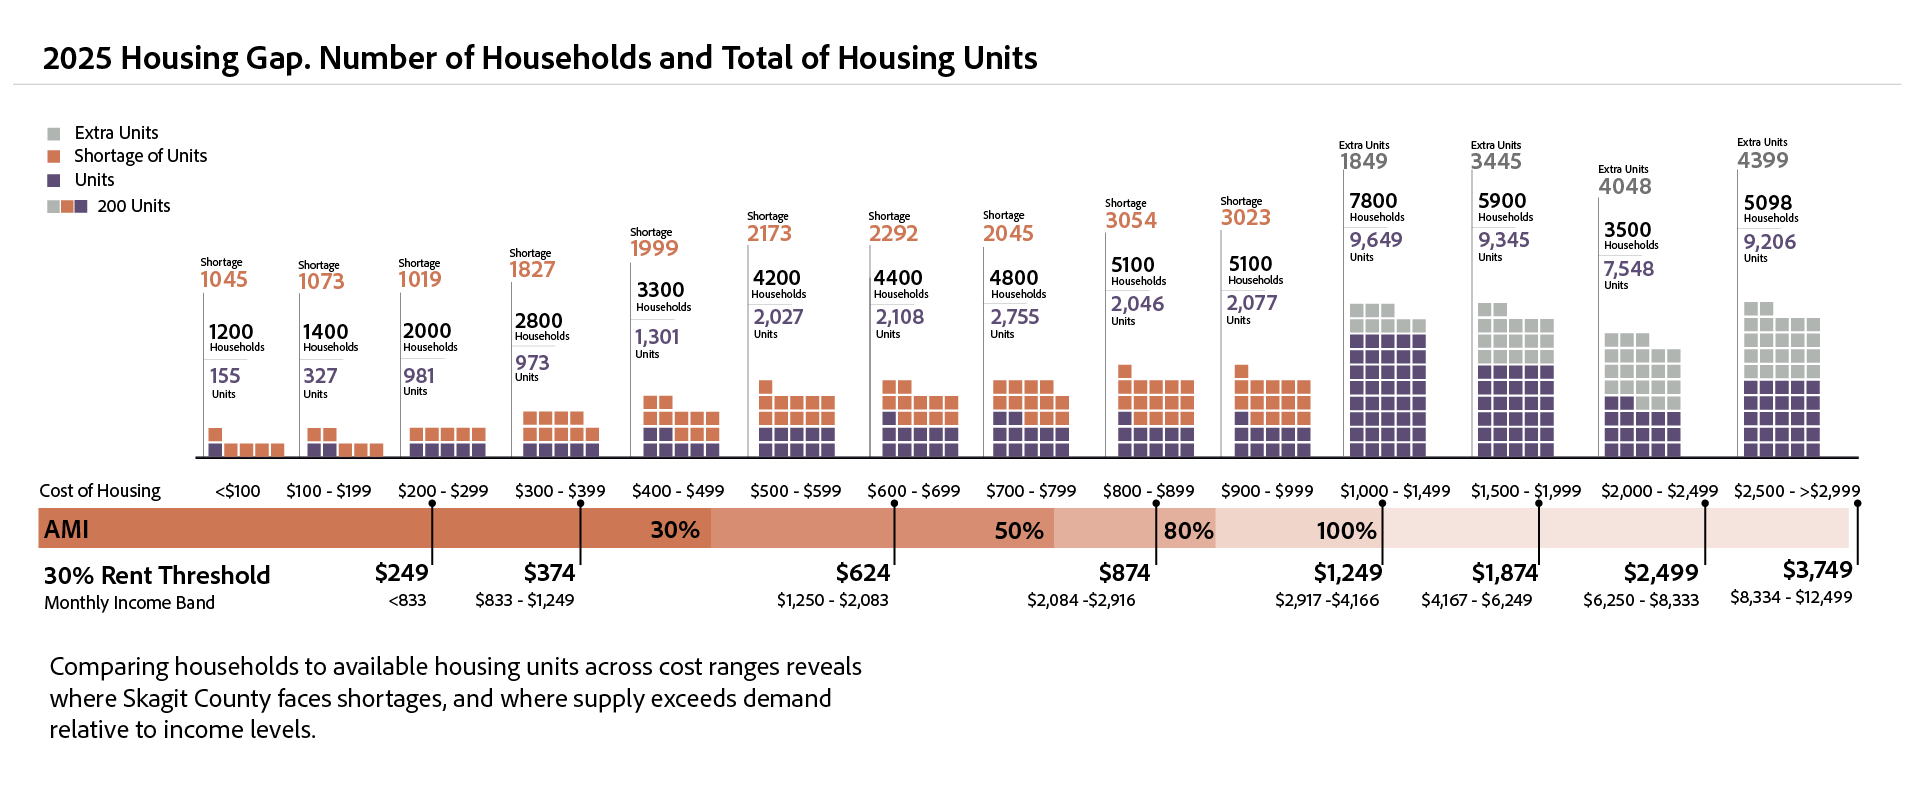
The chart shows housing supply plotted against household income, segmented by Area Median Income bands for Skagit County, Washington. The shortages in red are not uniform — they concentrate at the lower and middle cost ranges, where vacancies are fewest and competition sharpest.
This is the view most communities don't have. The data exists — in census tables, HUD counts, permit records — but lives in separate systems, updated on different schedules, measured in incompatible ways. The Hub assembles it.
The same analysis can be run for any county in the US.
What the report covers
-
Homelessness involves a range of experiences — transitional, episodic, chronic — each shaped differently by structural conditions, individual circumstances, and market dynamics. The report examines what the data actually shows about what predicts rates across places.
-
A look at housing stock as it actually exists — by cost range, tenure type, and availability — and how misalignments between supply and income distribution show up at each AMI band, not just at the median.
-
From today's foundation — real data for Skagit County, Washington — toward a platform where any community can model a portfolio of interventions and track whether they're working over time.
Built for the people who have to decide
People approach housing and homelessness from different directions — some through compassion, some through concern about public safety, some through fiscal discipline, some through evidence of what works. The Hub isn't designed to argue any one of those perspectives. It's designed to give all of them a shared picture of what's actually happening.
This report is an invitation — to planners, councils, foundations, nonprofits, and developers — to look at the data together and ask better questions. Not to adopt a theory, but to see more clearly.
The Vision Report goes deeper, with conceptual models, illustrative data, and a practical roadmap for communities ready to act.